
-
 DS01
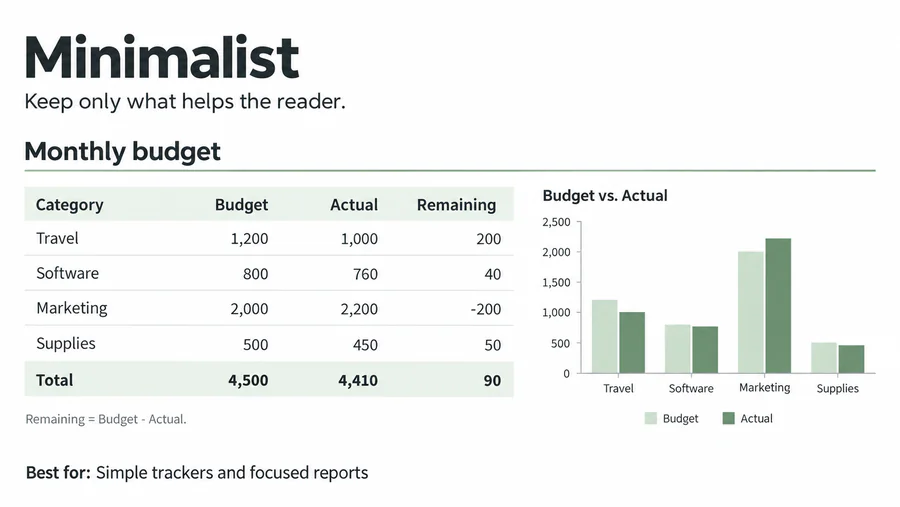
DS01Minimalist
Uses a small color palette, light borders, clear labels, and few decorative elements.
Best for Simple trackers, focused reports, and uncluttered dashboards.
-
 DS02
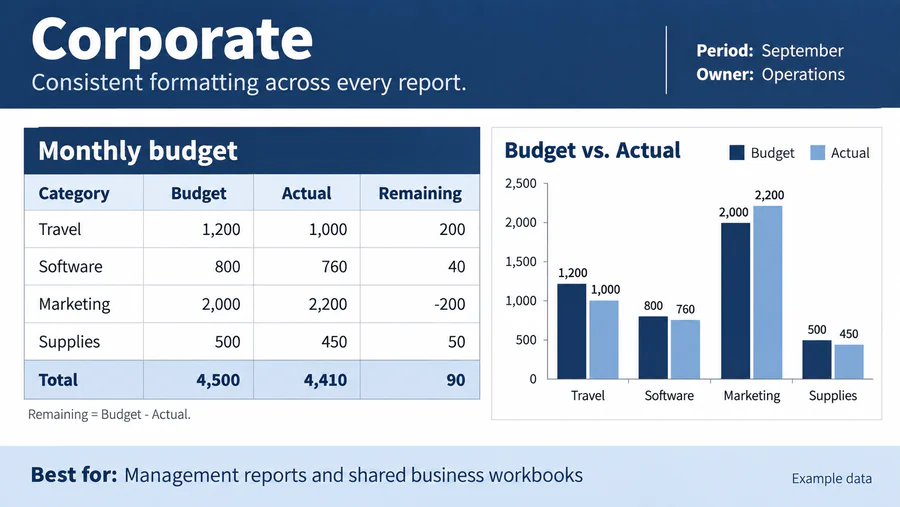
DS02Corporate
Uses consistent brand colors, restrained typography, and standardized headings and tables.
Best for Management reports and workbooks shared across a business.
-
 DS03
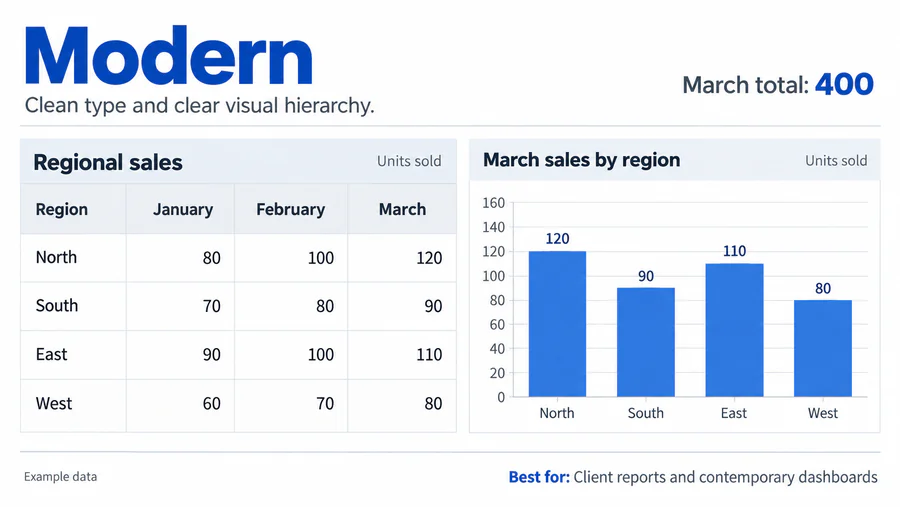
DS03Modern
Uses clean type, subtle separators, aligned content, and restrained accents for a contemporary appearance.
Best for Client-facing reports and current dashboard designs.
-
 DS04
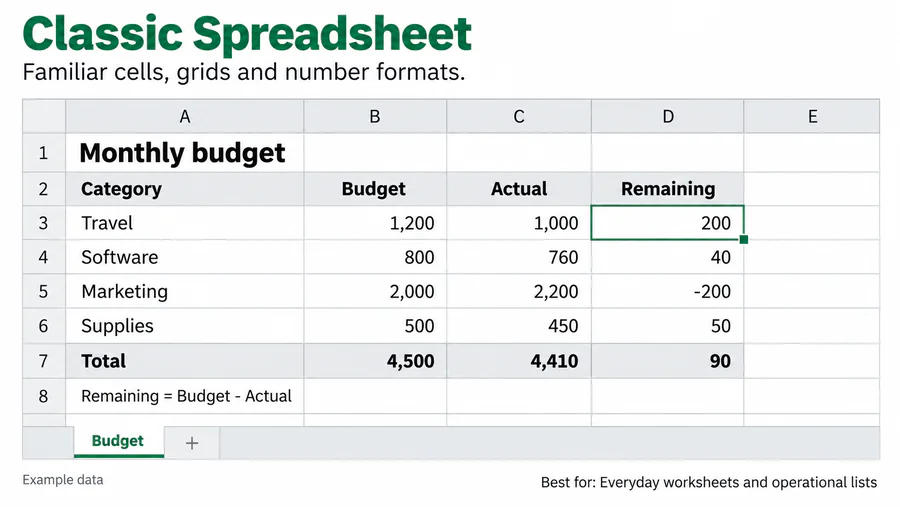
DS04Classic Spreadsheet
Uses visible cell grids, conventional headers, and straightforward numeric formatting.
Best for Operational lists, familiar data entry, and everyday worksheets.
-
 DS05
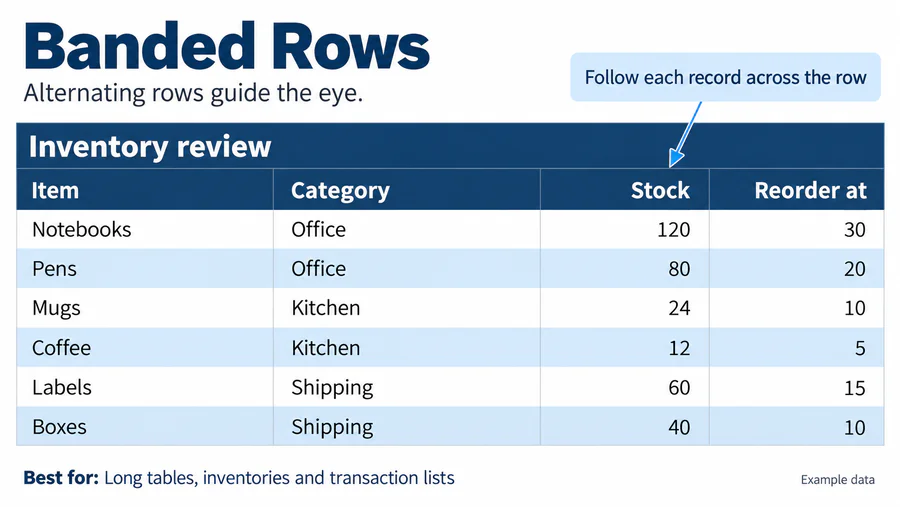
DS05Banded Rows
Alternates row fills to help the eye follow each record across several columns.
Best for Long tables, inventories, and transaction lists.
-
 DS06
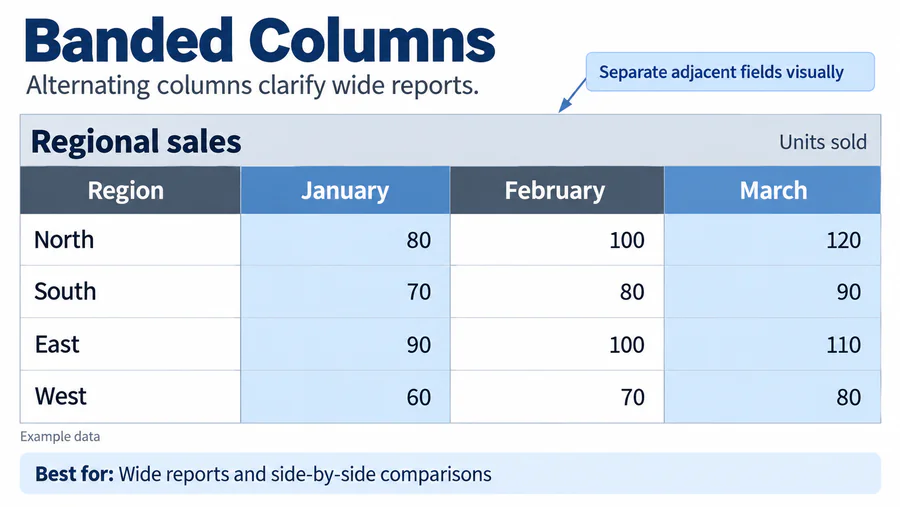
DS06Banded Columns
Alternates column fills to distinguish adjacent fields or groups of measurements.
Best for Wide reports and side-by-side comparisons.
-
 DS07
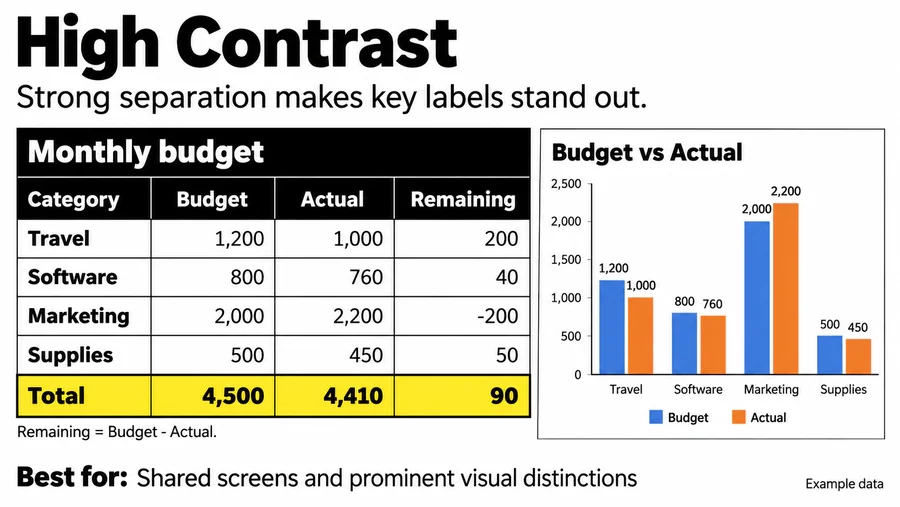
DS07High Contrast
Uses clearly separated text and background colors with strong emphasis on key labels.
Best for Shared screens and reports that need prominent visual distinctions.
-
 DS08
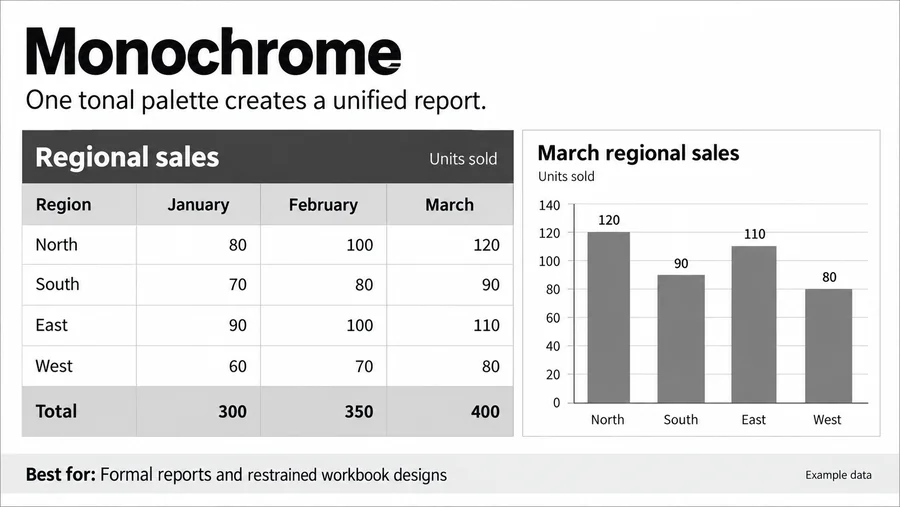
DS08Monochrome
Uses black, white, and gray or shades of a single color for a unified appearance.
Best for Formal reports and restrained workbook designs.
-
 DS09
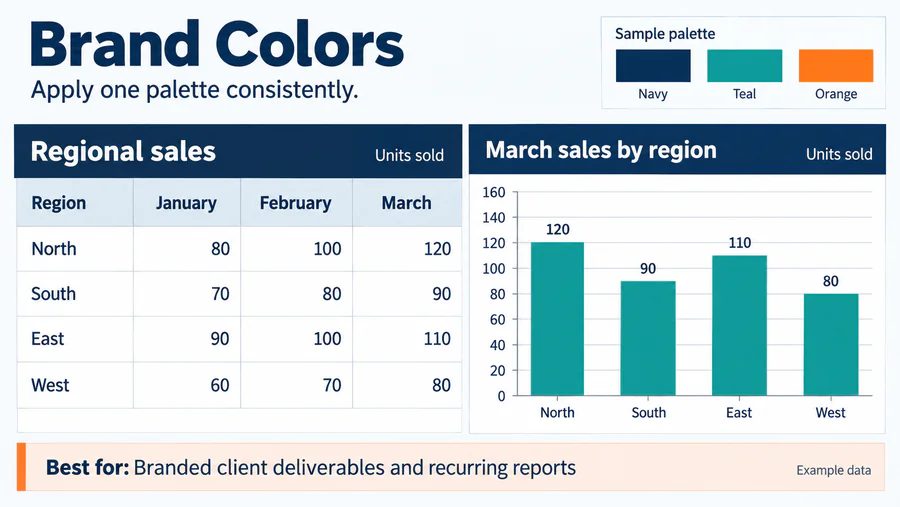
DS09Brand Colors
Applies an organization's palette consistently to headings, charts, and accents.
Best for Branded client deliverables and recurring company reports.
-
 DS10
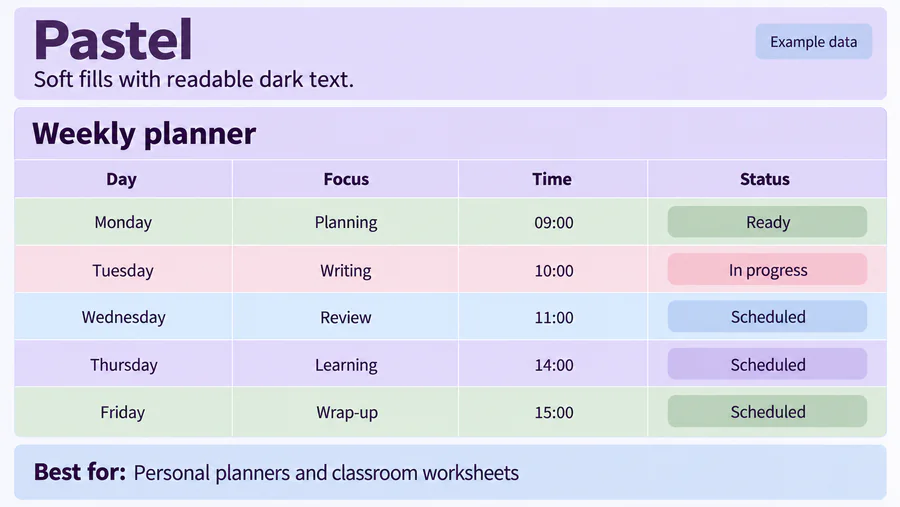
DS10Pastel
Uses soft fills and muted accents while keeping text dark enough to remain readable.
Best for Personal planners, classroom sheets, and lifestyle trackers.
-
 DS11
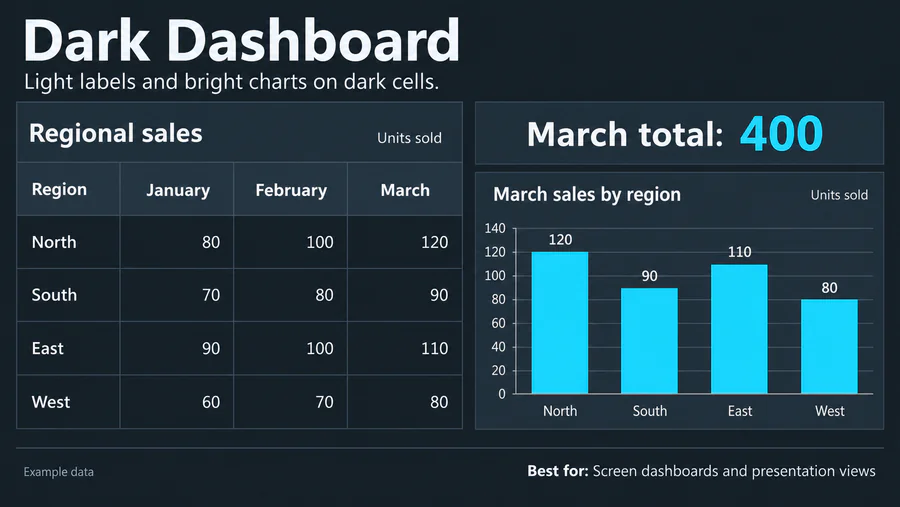
DS11Dark Dashboard
Uses dark worksheet fills, light labels, and bright chart accents in the report area.
Best for Screen-based dashboards and presentation views.
-
 DS12
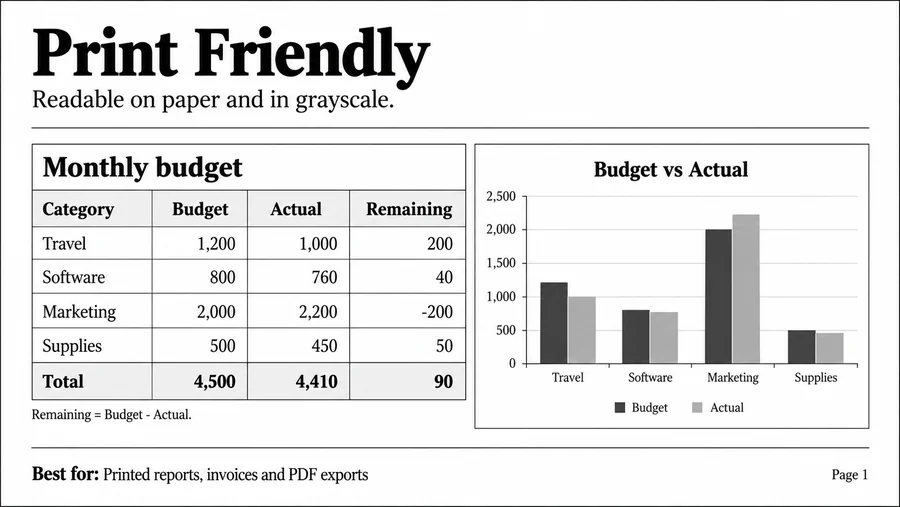
DS12Print Friendly
Uses a light background, restrained fills, and labels that remain clear in grayscale.
Best for Printed reports, invoices, and PDF exports.
-
 DS13
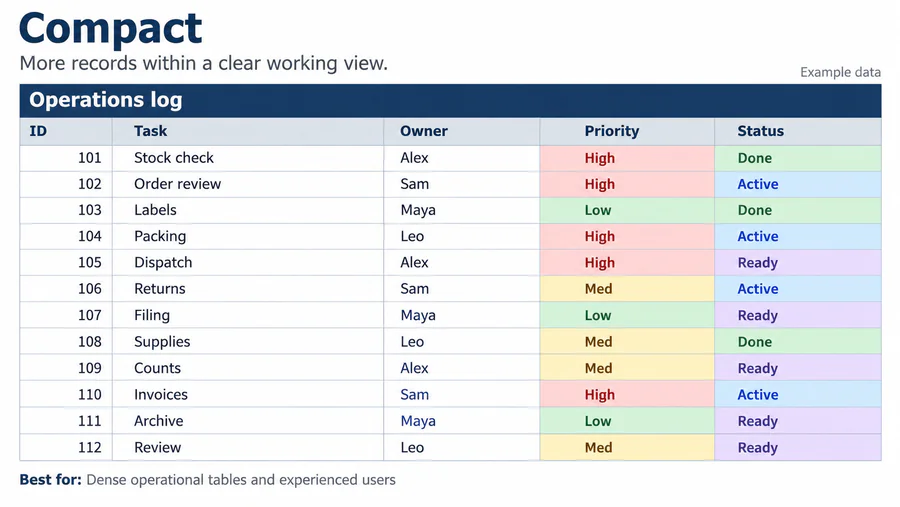
DS13Compact
Uses efficient row heights, concise headings, and limited empty space while preserving readable text.
Best for Dense operational tables and experienced users reviewing many records.
-
 DS14
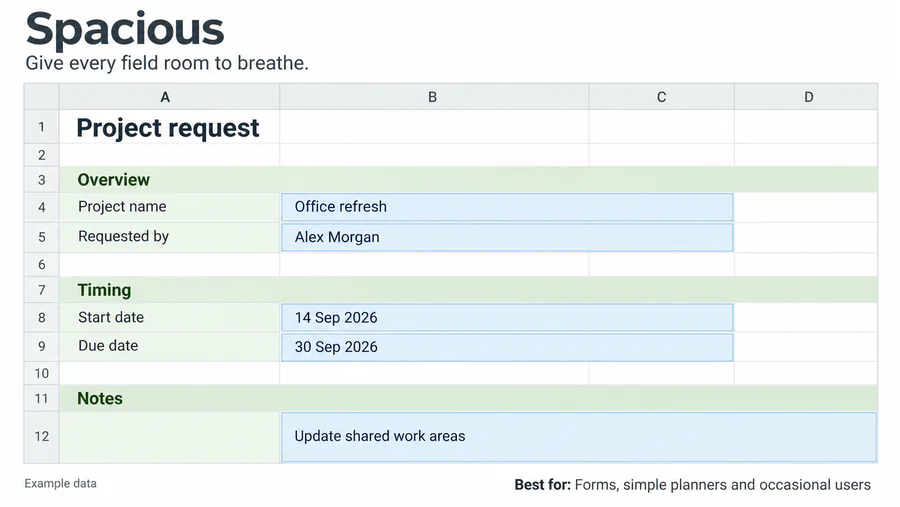
DS14Spacious
Uses larger input areas, comfortable row heights, and clear gaps between sections.
Best for Forms, simple planners, and occasional spreadsheet users.
-
 DS15
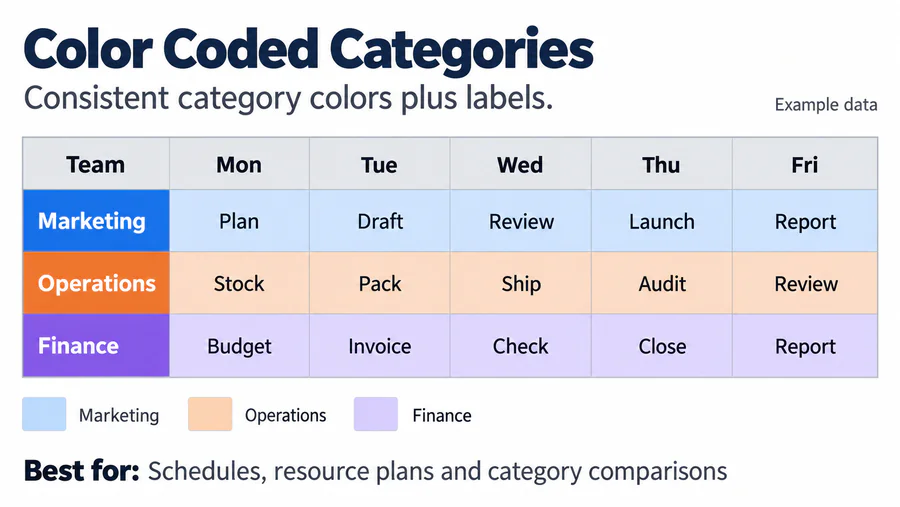
DS15Color Coded Categories
Assigns consistent colors to departments, projects, or other categories, with accompanying labels.
Best for Schedules, resource plans, and category comparisons.
-
 DS16
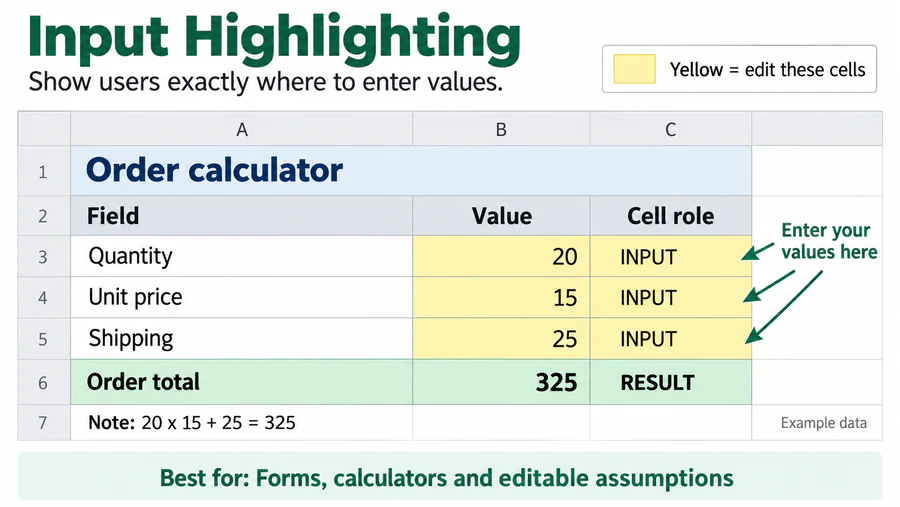
DS16Input Highlighting
Uses a consistent fill or border to identify cells users should complete or change.
Best for Forms, calculators, and workbooks with editable assumptions.
-
 DS17
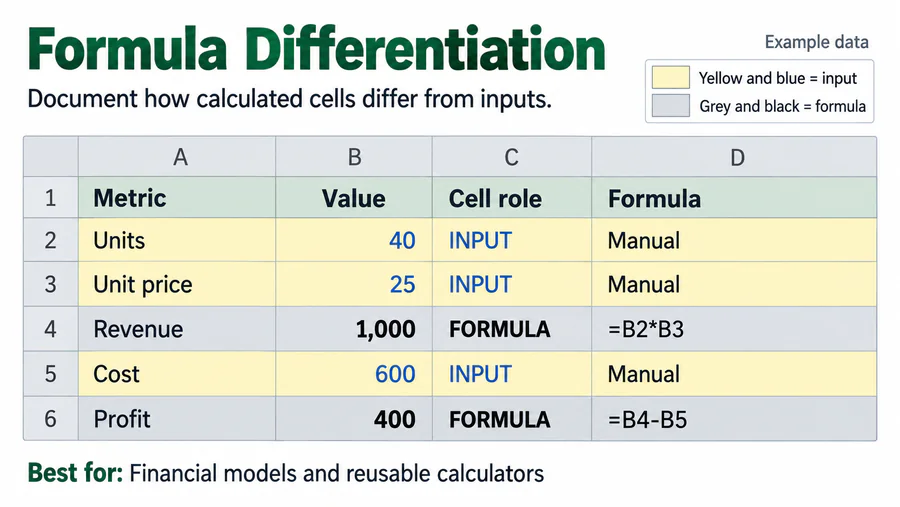
DS17Formula Differentiation
Uses a documented visual convention to distinguish calculated cells from manual inputs.
Best for Financial models and reusable calculation worksheets.
-
 DS18
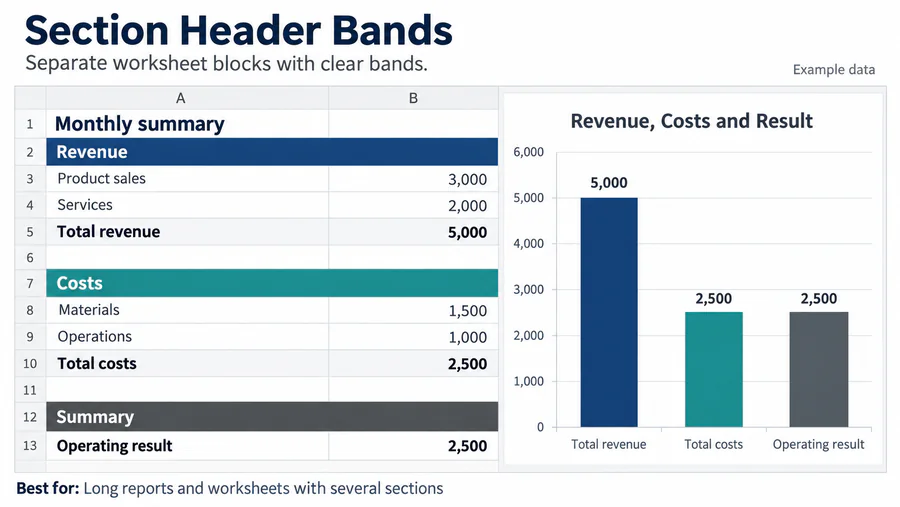
DS18Section Header Bands
Uses filled header rows to separate named sections and establish visual hierarchy.
Best for Long reports and worksheets with several distinct blocks.
-
 DS19
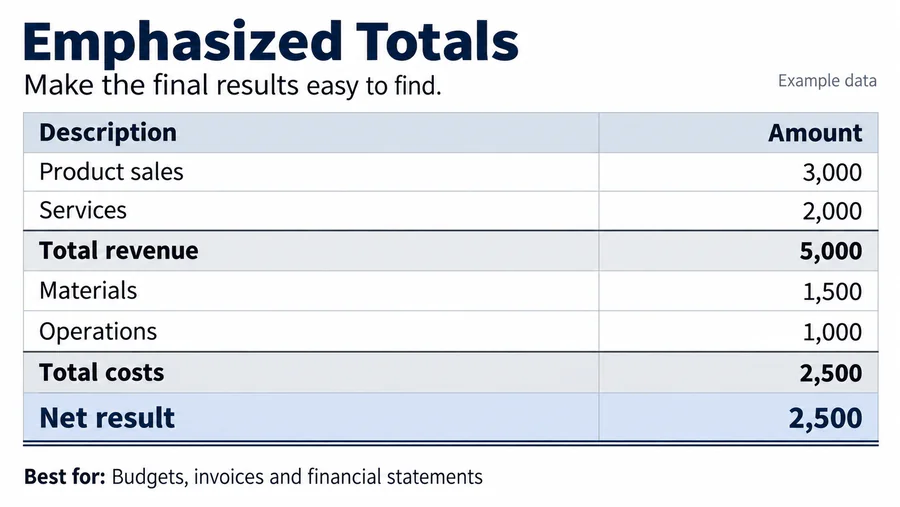
DS19Emphasized Totals
Uses bold type, borders, or a distinct fill to separate subtotals and final results from detail.
Best for Budgets, invoices, and financial statements.
-
 DS20
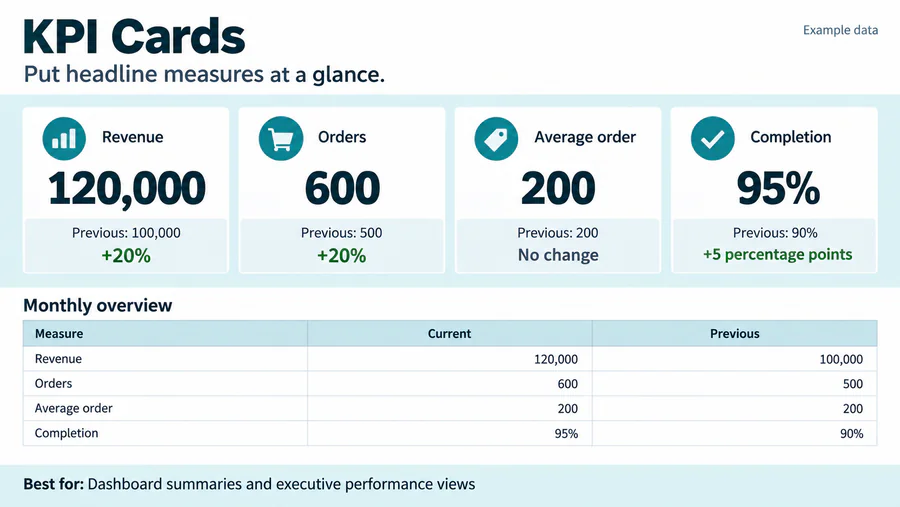
DS20KPI Cards
Presents each headline measure as a large value with a short label and relevant comparison.
Best for Dashboard summaries and executive performance views.
-
 DS21
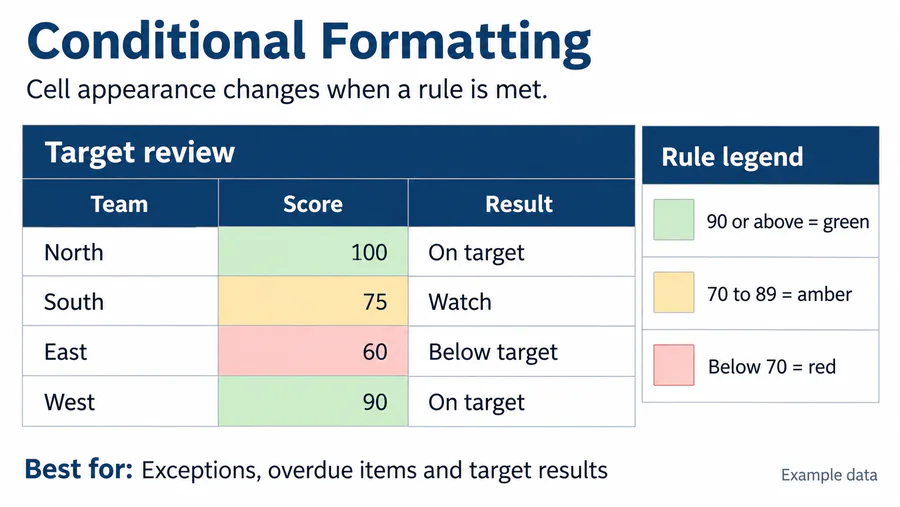
DS21Conditional Formatting
Applies formatting rules that change a cell's appearance when its value meets a condition.
Best for Highlighting overdue dates, exceptions, duplicates, and target results.
-
 DS22
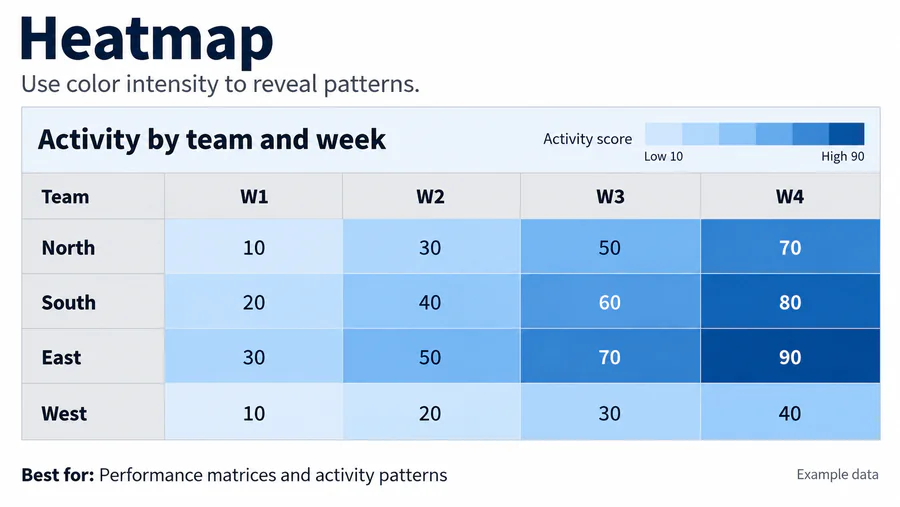
DS22Heatmap
Uses a color scale to show the relative size or distribution of values across cells.
Best for Performance matrices, activity patterns, and concentration analysis.
-
 DS23
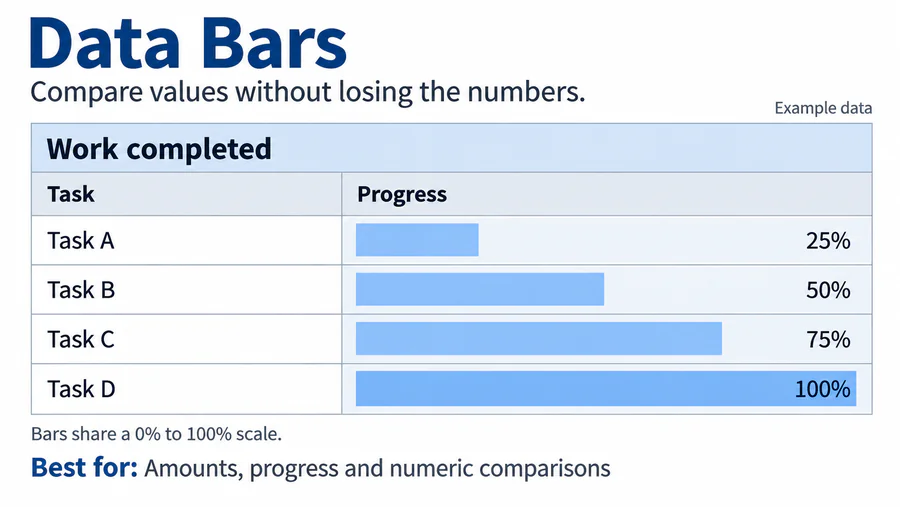
DS23Data Bars
Adds bars within cells so their lengths indicate the relative size of the underlying values.
Best for Comparing amounts or progress while keeping numbers visible.
-
 DS24
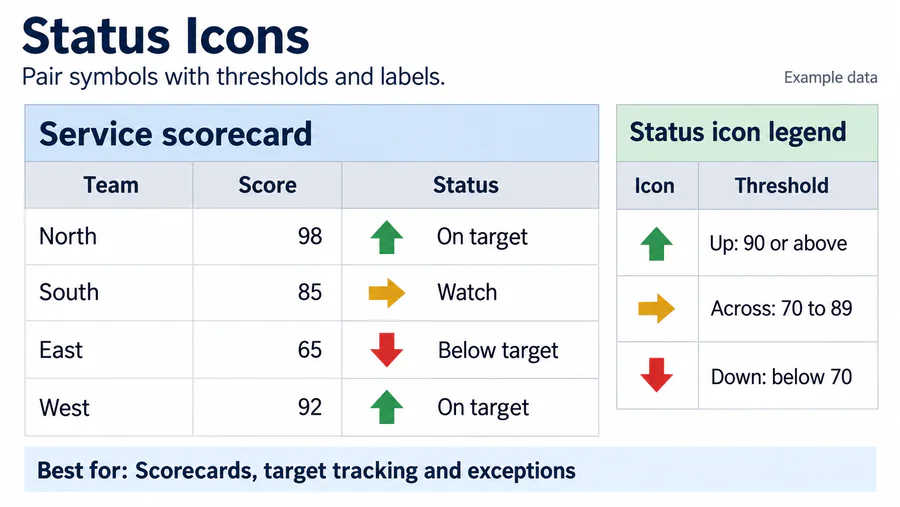
DS24Status Icons
Uses symbols or icon sets with defined thresholds and labels to communicate performance or status.
Best for Scorecards, target tracking, and exception monitoring.
-
 DS25
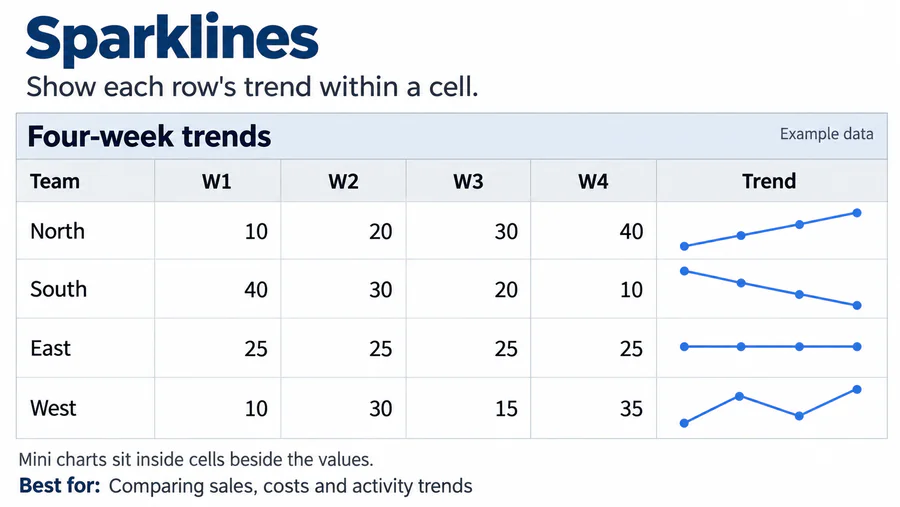
DS25Sparklines
Places miniature charts within cells to show trends alongside related values.
Best for Comparing sales, costs, or activity trends across many rows.
No keyword in this pack matches that search.